Using infographics to practice advocacy

Source: Infographic Archive – Click here to see more.

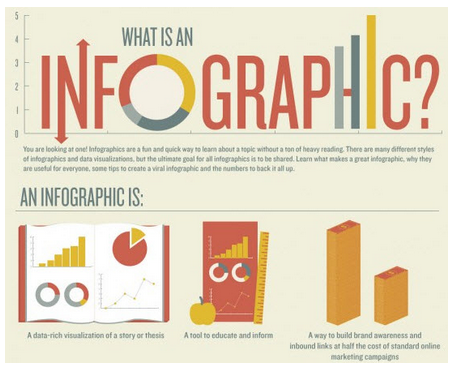
From Edudemic comes this useful how-to guide for making infographics

Infographics are used quite a bit in reporting Health news, and this could be a fun option for the kids when they’re trying to get facts and statistics out to the community.

Have them do surveys on campus about current Health issues, and then create infographics to get the information back out… another way to demonstrate advocacy that takes posters to a whole new level.

Here are some samples…

Infographic: Meditation in Schools Across America 

Infographic: 15 Scientifically Proven Ways to be Happier

And some useful tools to help get started…

Infogr.am

9 Powerful Free Infographic Tools To Create Your Own


More hints and tips in the classroom...

Questions?

[contact-form-7 id=”7″ title=”Contact form 1″]

Student Created Tech Use Policy

  Download your own editable doc here: My UP Family Agreement Korean My.U.P. Chinese My.U.P. In 2011, shortly after our school went 1-to-1, our 8th grade Health classes

SAS- G&D Scope and Sequence

SAS Scope & Sequence: Growth, Development, & Sexual Health Here are the standards as a word document: SAS G&D- Scope & Sequence Key: CT- Classroom teacher

Evaluating Health Websites

*This post originally appeared on choices.scholastic.com National Health Education Standard 3: Students will demonstrate the ability to access valid information, products and services to enhance health.

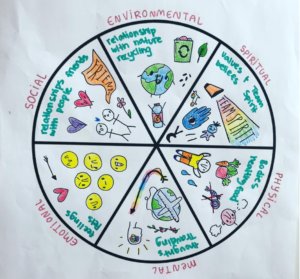
Advocacy through Art Project

Hey 7th graders! Here are the details for step one of your project. For teacher instructions, check out the details on this post for Choices