Using infographics to practice advocacy

Source: Infographic Archive – Click here to see more.

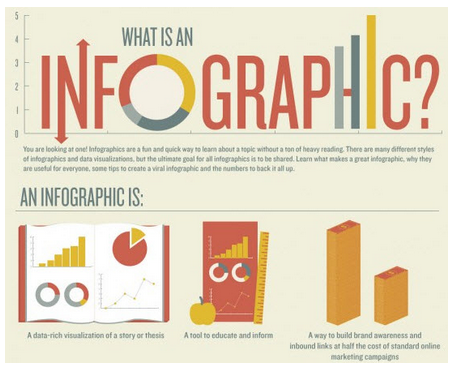
From Edudemic comes this useful how-to guide for making infographics

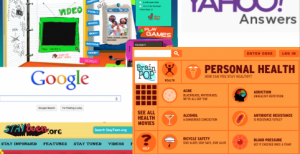
Infographics are used quite a bit in reporting Health news, and this could be a fun option for the kids when they’re trying to get facts and statistics out to the community.

Have them do surveys on campus about current Health issues, and then create infographics to get the information back out… another way to demonstrate advocacy that takes posters to a whole new level.

Here are some samples…

Infographic: Meditation in Schools Across America 

Infographic: 15 Scientifically Proven Ways to be Happier

And some useful tools to help get started…

Infogr.am

9 Powerful Free Infographic Tools To Create Your Own


More hints and tips in the classroom...

What is Technology Balance?

*Image courtesy of 9gag via my 7th grade class   In a 2011 study done by the McCann World Group, 53% of 16-22 year-olds said they would rather

PEACH 2016- Health

Click on the links below for more info, lesson plans, and project ideas! Google Doc for shared resources Tentative Agenda and Resources Welcome and Intros

Tech Balance

Looking at how technology and health intersect. Click on the specific topics for further information and links.

PHASE Online- 2021

Hey gang! Looking forward to our time together this week at PHASE Online. You can find the slides from our two workshops below, and as